How Data-Driven Design Improves Website Performance
Most founders fix the wrong thing.
They redesign when they should be measuring.
They add features when they should be removing friction.
Data-driven design is the discipline that tells you which problem to solve before you spend money solving it.
The cost of poor UX
Statistic
Impact
67%
Users won't return after a bad experience
$1.4T
Lost revenue from poor digital UX yearly
9,900%
ROI potential from UX research investments
A startup came to us with a conversion problem.
Their SaaS homepage looked polished. The copy was sharp. The product itself was genuinely good.
But free trial signups were stuck at 2.1%.
The team had redesigned the hero section three times in six months. Each time, conversion rates barely moved.
The problem was not the design.
The problem was that every decision was being made inside conference rooms by people debating button colors and headline copy without any understanding of how real users behaved on the page.
Data-driven design ends that cycle.
It replaces assumptions with behavioral evidence.
And at The Small Square, it is the foundation behind every design decision we make.
What Data-Driven Design Actually Means
Data-driven design is not about drowning in spreadsheets or running endless reports.
It is a simple principle:
Before changing something on your website, understand why it is underperforming.
After changing it, measure whether the change actually worked.
For non-technical founders, think about your website like a salesperson.
If your salesperson was losing deals, you would not just buy them a better suit and send them back out.
You would ask:
- Where are prospects losing interest?
- What objections keep coming up?
- Which parts of the pitch work?
- Which parts create hesitation?
Data gives you those answers for your website.
Every click, scroll, pause, and exit is a signal.
Data-driven design is the practice of reading those signals and acting on them.
A lesson we learned early
“The best design decision we ever made for a client was deleting a section, not adding one. Data showed 80% of users never scrolled past the hero. Everything below it was effectively invisible. Removing friction increased trial signups by 34%.”
— Asaad Mahmood, Founder, The Small Square
What data-driven design is NOT
Data-driven design does not mean:
- Design by committee
- Endless dashboards
- A/B testing every pixel
- Ignoring aesthetics
- Removing creativity from design
It simply means having enough behavioral evidence to make confident decisions.
The Tools You Actually Need
You do not need an enterprise analytics stack to start making intelligent design decisions.
For most SaaS startups, these categories cover 90% of what matters.
Core tool stack
Tool Category
What It Answers
Recommended Tools
Traffic Analytics
Where users come from and where they leave
Google Analytics 4, Plausible
Behavior Tracking
What users click, scroll, or hesitate on
Hotjar, Microsoft Clarity
Session Recording
What real user sessions look like
Hotjar, FullStory, LogRocket
A/B Testing
Which variation performs better
VWO, Optimizely
Heatmaps
Which sections attract attention
Hotjar, Crazy Egg
User Feedback
Why users behave the way they do
Typeform, Intercom
Where to start if you have nothing set up
Start with Microsoft Clarity.
It is free, takes less than 10 minutes to install, and immediately gives you:
- heatmaps,
- session recordings,
- rage clicks,
- and scroll tracking.
One week of recordings often reveals more insight than months of looking at page views.
The Metrics That Actually Matter
Most websites track metrics that do not connect to revenue.
These are the metrics that matter:
Conversion Rate
What percentage of users complete the action you want?
Examples:
- booking a call,
- starting a free trial,
- purchasing,
- or submitting a form.
Activation Rate
Of the people who signed up, how many completed the core action that demonstrates product value?
Scroll Depth
How far do users get before leaving?
If 70% of users never reach your pricing section, that section is functionally invisible.
Rage Clicks
Repeated clicks on non-clickable elements.
This usually indicates:
- misleading UI,
- broken expectations,
- or poor visual hierarchy.
Bounce Rate by Source
Users arriving from Google behave differently from users arriving through LinkedIn ads.
Segment your traffic sources or your data becomes meaningless.
Finding UX Friction
Friction is any point where user momentum slows down, stops, or reverses.
Every website has friction.
The difference between high-converting websites and low-converting websites is how quickly teams identify and remove it.
STEP 1 — Build Your Funnel
Map the full journey from first visit to conversion.
For SaaS websites, it usually looks like this:
Landing page visit
↓
Scrolls past hero section
↓
Reaches pricing or CTA section
↓
Clicks primary CTA
↓
Signup form loads
↓
Completes signup form
↓
Email verification
↓
Onboarding begins
↓
Activation event
Each step is a drop-off opportunity.
Your job is to identify the biggest one first.
STEP 2 — Find the Largest Drop-Off
Use Google Analytics 4 funnel exploration reports.
Look for:
- the step where most users exit,
- the point where momentum breaks,
- and where conversion collapses.
That becomes your priority.
Not the prettiest page.
Not the newest feature.
The biggest leak.
STEP 3 — Watch Session Recordings
After identifying the drop-off point, watch 20–30 recordings from users who exited there.
Patterns appear quickly.
Common patterns we see
Users pause and leave
The content failed to answer an important question.
Users click something that is not clickable
The visual hierarchy is misleading.
This is usually a design issue, not a copy issue.
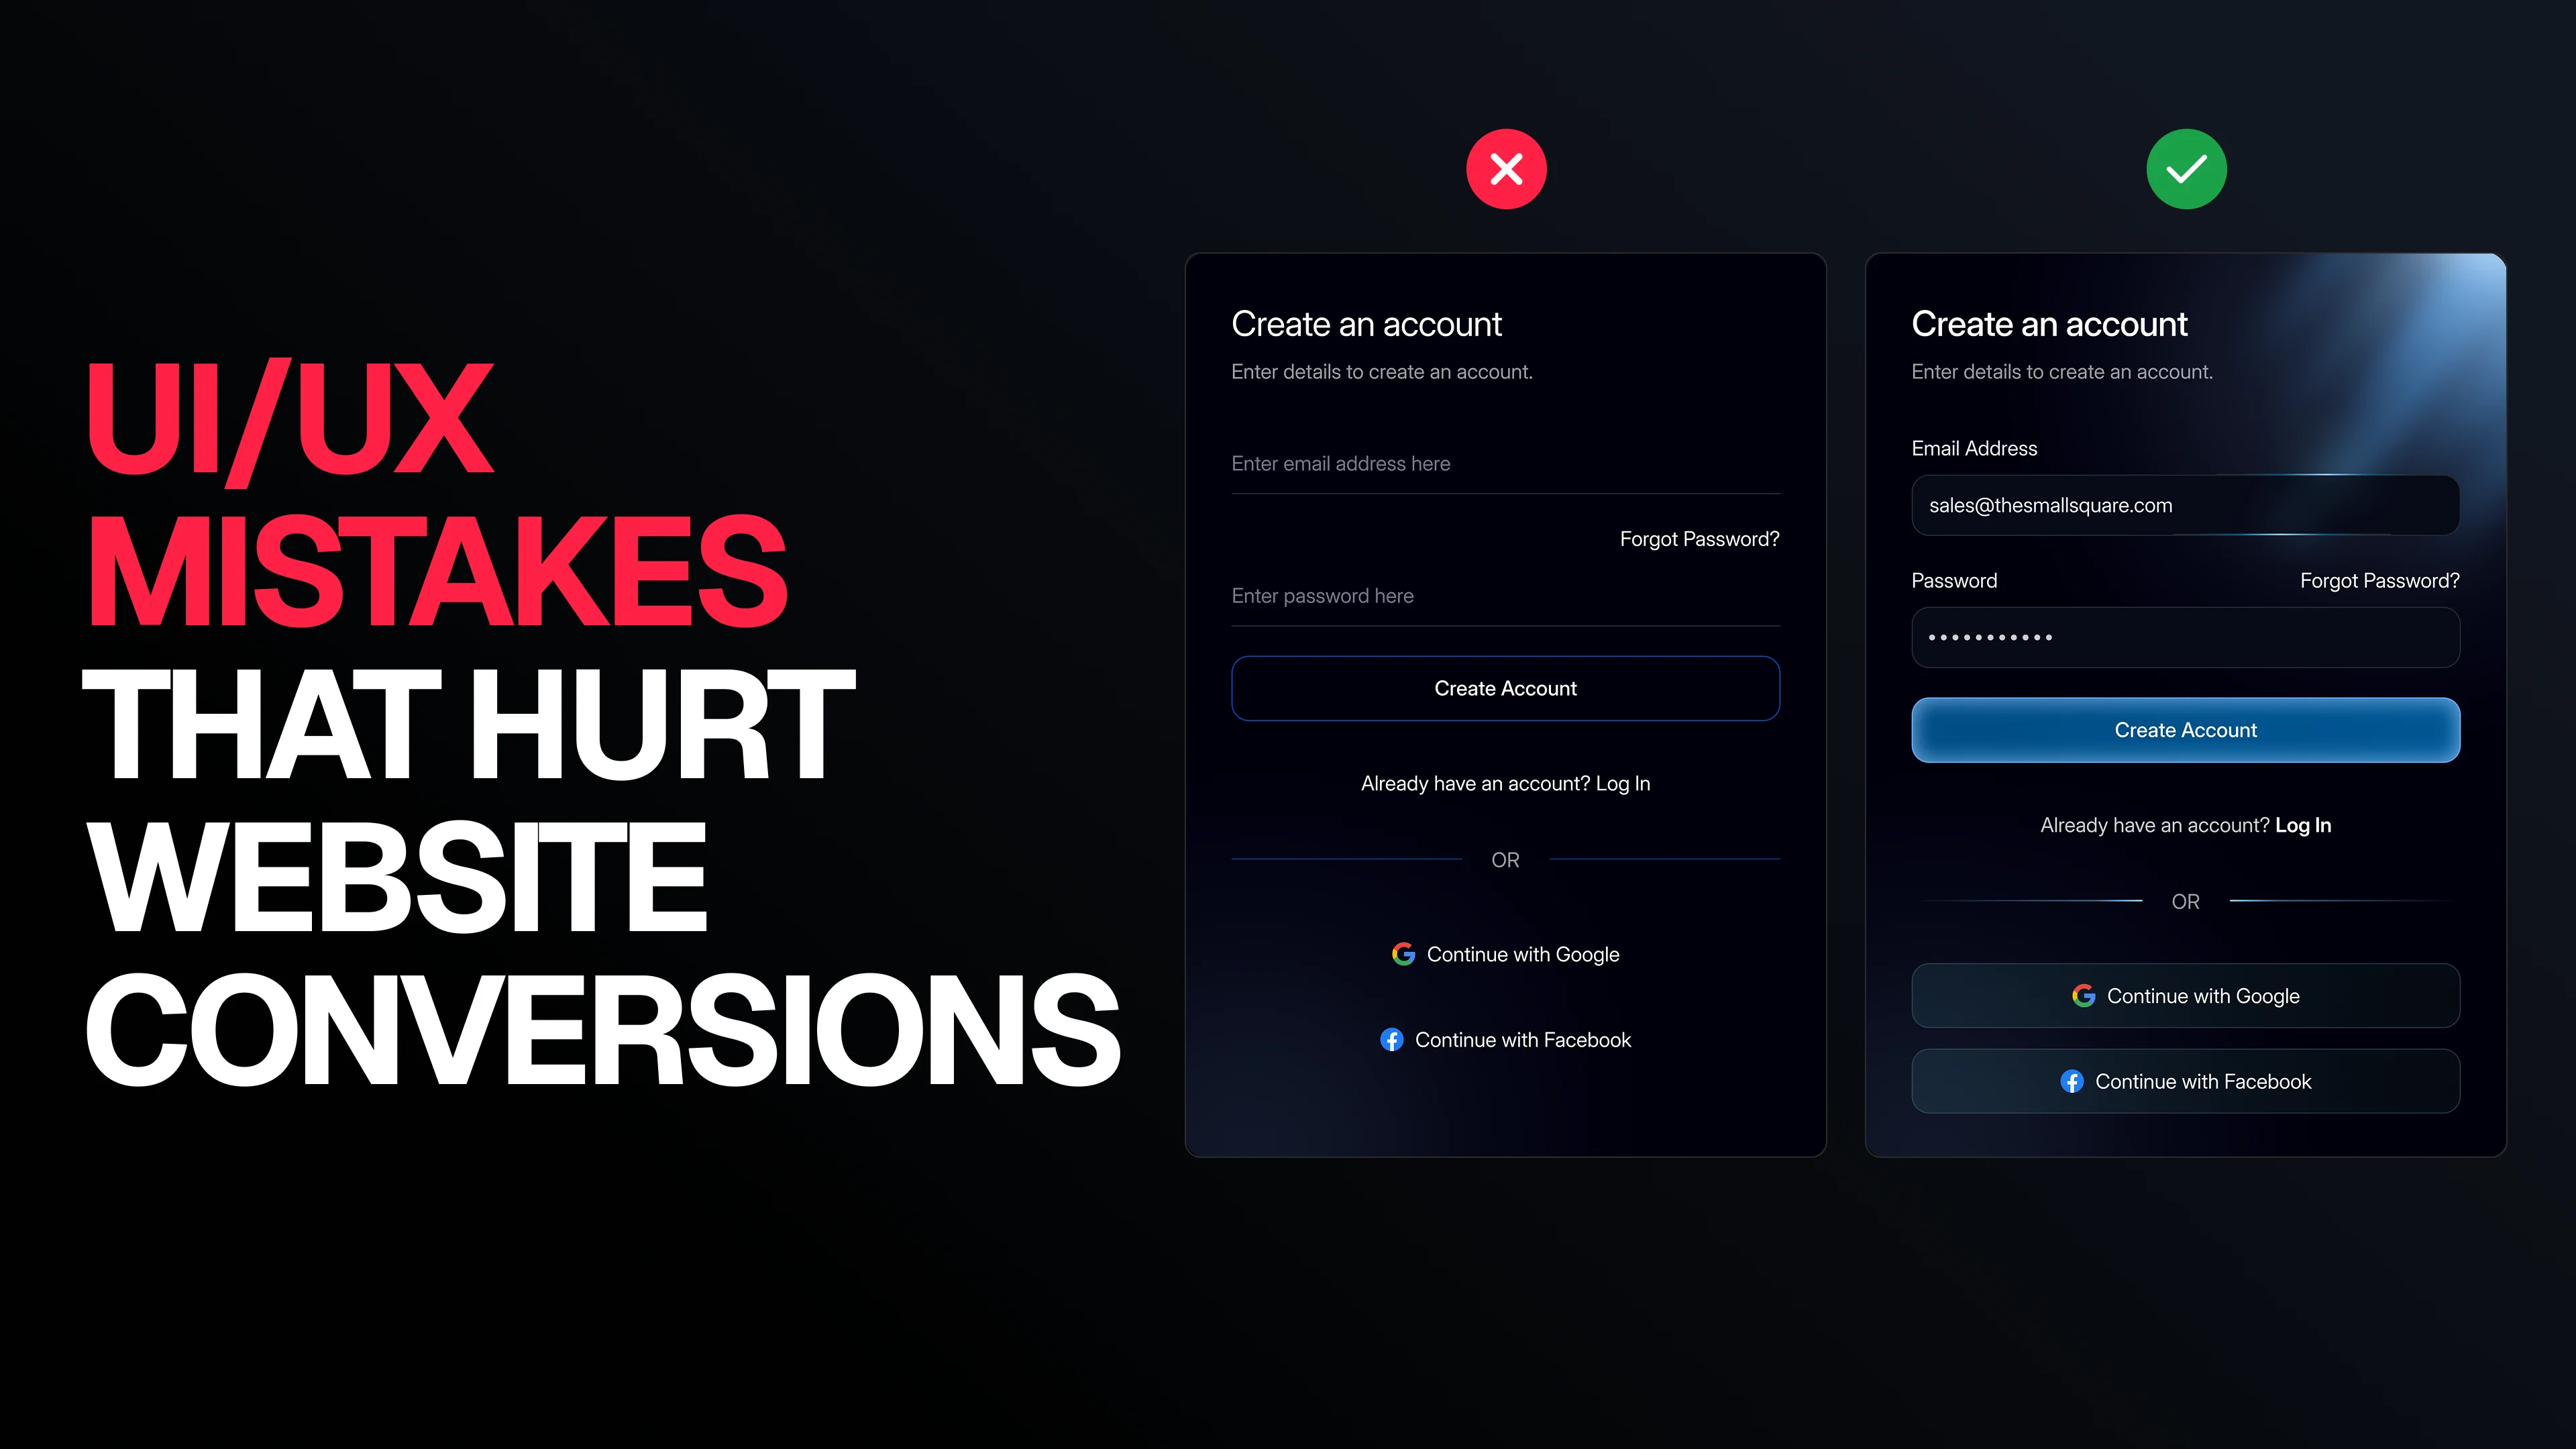
Users abandon forms halfway through
Common reasons:
- too many fields,
- poor trust signals,
- asking for unnecessary information,
- or forcing billing too early.
Users instantly hit back
Usually a messaging mismatch.
The landing page headline does not match the ad, search intent, or referral source.
Real example from a client audit
Session recordings showed users hovering over a SaaS pricing comparison table for 30–40 seconds before leaving.
The issue was not pricing.
It was decision paralysis.
We reduced 4 plans to 3 and highlighted the middle option as “Recommended.”
Pricing page conversion increased by 28% within three weeks.
How to Run A/B Tests That Produce Real Answers
Most A/B tests fail because teams:
- test too many variables,
- stop tests too early,
- or interpret tiny sample sizes as meaningful.
Here are the rules we follow.
Rule 1 — Test One Variable at a Time
If you change:
- the headline,
- CTA copy,
- and button color together,
you cannot know what caused the result.
One variable per test.
Always.
Rule 2 — Run Tests for at Least Two Weeks
User behavior changes throughout the week.
A test that only runs Monday to Friday is incomplete.
Minimum:
- 2 full weeks
- 2 complete user cycles
Rule 3 — Define Success Before Launch
Decide your success metric before running the experiment.
Examples:
- CTA click-through rate
- form completion rate
- signup conversion rate
Never change the goal after seeing results.
Rule 4 — Wait for Statistical Significance
Do not declare winners too early.
Minimum recommendation:
- 95% confidence level
Without significance, you are reacting to noise.
What is Worth Testing?
Worth Testing
Why
CTA copy
Direct impact on conversion
Hero headline
Shapes first impression
Number of form fields
Impacts completion rate
Pricing page structure
High-intent page
Social proof placement
Influences trust timing
What is Usually a Waste of Time?
Low-Impact Tests
Why
Border radius changes
Minimal behavioral impact
Tiny font variations
Rarely measurable
Logo placement tweaks
Users barely notice
Footer redesigns
Very low engagement
Example A/B Test
Control
“Get Started”
Variant
“Start My Free Trial”
Hypothesis
Specific copy reduces perceived commitment and improves click-through rate.
Success Metric
CTA click-through rate
Minimum Sample
500 clicks per variation
Test Duration
2 weeks minimum
What we consistently find
Across multiple SaaS websites, specific outcome-focused CTA copy typically outperforms generic verbs by 14–22%.
Personalization: Showing the Right Message to the Right User

Not every visitor arrives with the same intent.
A user from Google behaves differently from:
- a LinkedIn visitor,
- a returning trial user,
- or someone already familiar with your brand.
Basic personalization does not require AI or machine learning.
It requires behavioral awareness.
Three Levels of Personalization
Level
Description
Implementation
Impact
Traffic Source
Different messaging for Google vs LinkedIn traffic
UTM-based content blocks
Medium
Return Visitors
Different CTA for returning users
Cookie-based logic
Medium–High
Behavioral Personalization
Dynamic content based on engagement behavior
Segment or CDP tools
High
At The Small Square, traffic-source personalization is implemented on most SaaS landing pages by default.
Even lightweight personalization consistently improves conversions by 15–25% compared to static messaging.
The Biggest Mistakes Teams Make
Even teams trying to be “data-driven” often misinterpret the data.
These are the most common mistakes we see.
Mistake 1 — Optimizing the Wrong Metrics
Page views are not business metrics.
Time on page is not a business metric.
Revenue-connected metrics matter:
- conversion rate,
- activation,
- retention,
- customer acquisition efficiency.
Mistake 2 — Running Tests Without Enough Traffic
Low traffic produces unreliable conclusions.
If a page only receives a few hundred visitors monthly, qualitative research is more valuable than A/B testing.
Use:
- session recordings,
- user interviews,
- and friction analysis instead.
Mistake 3 — Ignoring Qualitative Research
Analytics show what users do.
User interviews explain why they do it.
Both matter.
Mistake 4 — Redesigning Instead of Iterating
Most websites do not need complete redesigns.
They need targeted friction removal.
Iteration beats massive redesigns almost every time.
Mistake 5 — Treating Data as the Final Answer
Data reveals the problem.
It does not automatically reveal the solution.
A pricing-page drop-off could indicate:
- confusing plans,
- weak trust signals,
- slow loading,
- poor hierarchy,
- or unclear messaging.
Good design thinking is still required.
A Practical 6-Step Process
You do not need to implement everything immediately.
This is the exact order we recommend for SaaS startups.
1. Install Behavior Tracking
Use:
- Microsoft Clarity
- Hotjar
Let data collect for 2–4 weeks before major redesign decisions.
2. Build Funnel Tracking
Map:
- landing page,
- CTA,
- signup,
- onboarding,
- activation.
Track drop-offs between every stage.
3. Find the Biggest Leak
Identify the largest drop-off point.
Fix one problem at a time.
4. Watch Session Recordings
Review 20–30 recordings from users dropping at that stage.
Patterns become obvious quickly.
5. Make One Change
Do not redesign everything.
Fix:
- one friction point,
- one usability issue,
- one messaging problem.
Then measure.
6. Repeat
The highest-converting websites are not the prettiest.
They are the ones that iterate consistently.
Recommended Timeline
Stage
Time Investment
Outcome
Install tracking
2–4 hours
Behavioral data begins
Funnel setup
4–8 hours
Visibility into conversion leaks
Friction audit
4–6 hours
Top problems identified
First optimization
1–3 days
Initial improvement deployed
Measurement period
2–4 weeks
Performance validated
Second iteration
Ongoing
Compounding improvements
Your website probably does not have a design problem.
It has a friction problem.
At The Small Square, we combine:
- behavioral analytics,
- UX strategy,
- funnel analysis,
- and conversion-focused design
to identify exactly where users drop off and why.
What our audits include
✔ Funnel analysis
✔ Heatmap review
✔ Session recording analysis
✔ UX friction identification
✔ Conversion-focused recommendations
✔ Prioritized implementation roadmap
We only take on a limited number of projects at a time because meaningful optimization requires focus.
If your website is underperforming, the problem is usually diagnostic before it is visual.


Accepted Payments


